Business Cycle & Asset Allocation
CFA Level III — Capital Market Expectations, Part 1 & 2 | Exam Review: Initial Recovery → Contraction
1. The Business Cycle: Five Phases
The business cycle describes fluctuations of real GDP around its long-term trend growth rate. Business-cycle analysis is most useful for tactical (short- to intermediate-horizon) asset allocation — capital markets tend to lead the real economy — and its usefulness declines for long horizons that span one or more full cycles.
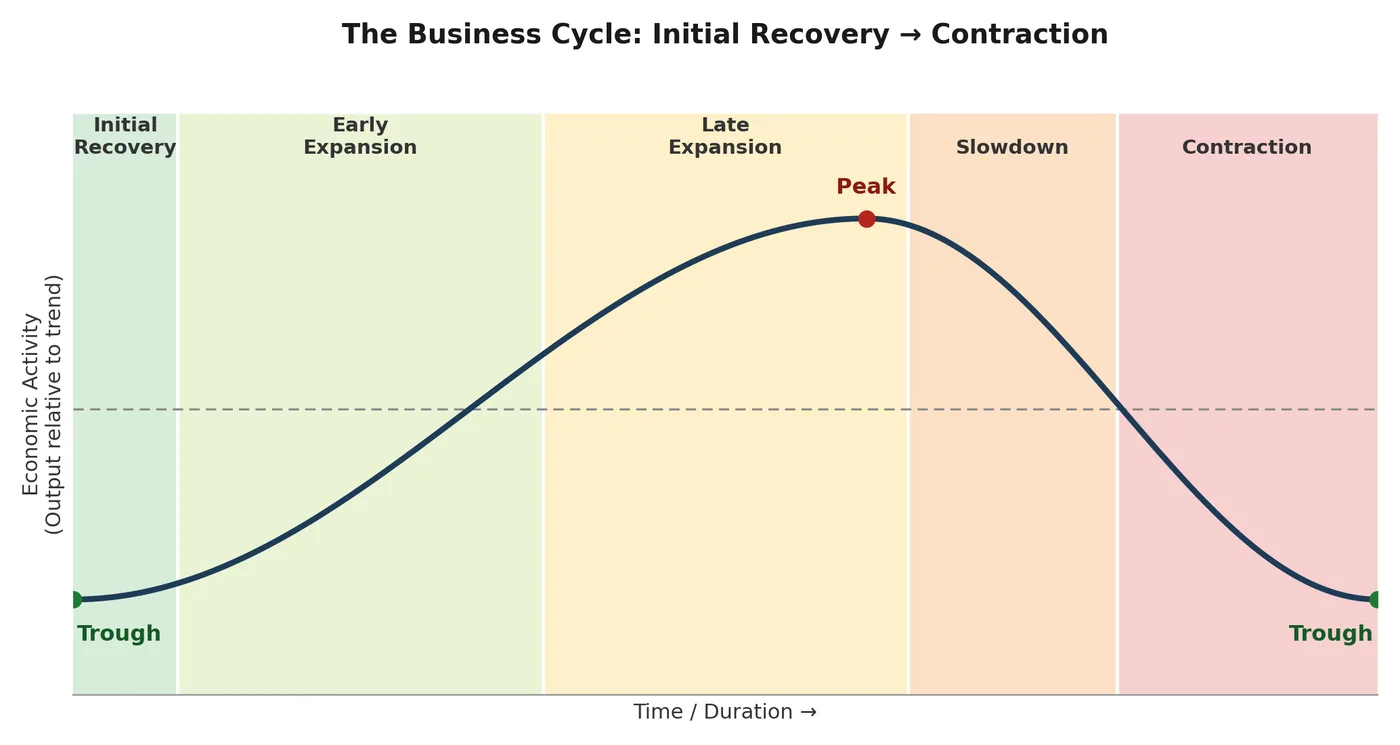
2. Phase-by-Phase Characteristics
| Phase & Duration | Growth / Confidence / Inflation | Monetary Policy & Rates | Bonds (Yields, Prices, Curve) | Equities | Real Estate & Other Assets |
|---|---|---|---|---|---|
① Initial Recovery Duration: a few months |
|
|
|
|
|
② Early Expansion Duration: 1 year to several years |
|
|
|
|
|
③ Late Expansion Duration: variable |
|
|
|
|
|
④ Slowdown Duration: a few months to a year or longer |
|
|
|
|
|
⑤ Contraction Duration: 12 to 18 months |
|
|
|
|
|
3. Inflation, Policy & Markets Across the Cycle
| Phase | Inflation | Economic Policy | Markets |
|---|---|---|---|
| Initial recovery | Initially declining | Stimulative |
|
| Early expansion | Low, with good growth | Becoming less stimulative |
|
| Late expansion | Increasing | Becoming restrictive |
|
| Slowdown | Continuing to accelerate | Still restrictive |
|
| Contraction | Real activity falling, inflation peaking | Easing |
|
4. Inflation Scenarios & Asset-Class Impact
| Scenario | Cash Equivalents | Bonds | Equities | Real Estate |
|---|---|---|---|---|
| Inflation within expectations | Earns the real rate of interest | Short yields more volatile than long yields | No impact — growth is predictable | Neutral — typical returns |
| Inflation above / below expectations | Positive (negative) as yields rise (fall) | Long yields more volatile than short yields | Negative — risk of central bank action / limited cost pass-through | Positive if above (rental income & values rise); negative if below |
| Deflation | Positive if nominal rates are floored near 0% | Positive — fixed cash flows gain purchasing power | Negative — economic activity & earnings decline | Negative — property values generally decline |
5. The Yield Curve Over the Cycle
-
Steepest near the trough; flattens as the expansion matures; flat-to-inverted near the peak; re-steepens through Contraction, typically steepest just before Initial Recovery.
-
Both policies stimulative → steep curve, economy likely to expand. Both restrictive → inverted curve, economy likely to contract. Mixed policy signals → flat or moderately steep curve, direction less clear.
Exam trap: A flattening/inverted curve + widening credit spreads + short rates still falling is easy to mistake for “Slowdown” — but in Slowdown, short rates are still near their peak and the curve is only flat-to-inverted. That combination is actually the signature of Contraction. |
6. Key Exam Takeaways
-
Markets lead the real economy — risk assets (small-cap equity, high-yield bonds) rally first, near the trough, ahead of any pickup in the real economy.
-
Late-expansion risk: as the peak nears, inflation emerges and bond/equity prices face downward pressure; the central bank risks overtightening. A “soft landing” means raising rates just enough to cool inflation without triggering a recession.
-
Time horizon matters: business-cycle phase analysis is most useful for short-/intermediate-term (tactical) allocation; its usefulness fades for long-term strategic allocation spanning a full cycle.
-
Deflation is the most dangerous scenario — negative for equity and real estate, positive for bonds (purchasing power) and cash (if nominal rates are floored near 0%); can trigger default via negative home equity.
-
Negative policy rates are typically associated with Contraction or Initial Recovery.